
はじめに
前回、ラズパイのCPUの温度をモニタリングにて、Victoria MetricsのUIにて表示するところまで確認できました。
せっかくなので、Grafanaのダッシュボードで表示させるところまで実装しようと思います。
実装
python側
CPUの温度の値を取得するpythonコードに関しては、前回のコードに加えて、各Nodeの値を取得するので、NODEという変数を追加しています。(ハイライトの部分です)
import requests
import time
import os

NODE = os.getenv("NODE_NAME", "unknown")

def get_cpu_temp():
    with open("/sys/class/thermal/thermal_zone0/temp") as f:
        return float(f.read().strip()) / 1000.0

while True:
    temp = get_cpu_temp()
    print(NODE)
    data = (
        f'rpi_cpu_temperature_celsius'
        f'{{node="{NODE}"}} {temp}\n'
    )

    r = requests.post(
        "http://victoria-metrics-victoria-metrics-cluster-vminsert.monitoring:8480/insert/0/prometheus/api/v1/import/prometheus",
        data=data,
        timeout=5,
    )

    print("status:", r.status_code, r.text)
    time.sleep(300)
demaonset.yamlの中身は以下のようになっています。ハイライトの箇所が今回変更した部分で、hostnameを取得してNODEに設定しています。
apiVersion: apps/v1
kind: DaemonSet
metadata:
  name: python-metrics
spec:
  selector:
    matchLabels:
      app: python-metrics
  template:
    metadata:
      labels:
        app: python-metrics
    spec:
      containers:
        - name: python
          image: appare99/metrics-python:v0.0.7
          command: ["sh", "-c"]
          args:
            - |
              pip3 install requests
              export NODE_NAME=$(cat /host/etc/hostname)
              python3 /data/get_cpu_temp.py
          volumeMounts:
            - name: host-sys
              mountPath: /sys
              readOnly: true
            - name: host-hostname
              mountPath: /host/etc/hostname
              readOnly: true
      volumes:
        - name: host-sys
          hostPath:
            path: /sys
            type: Directory
        - name: host-hostname
          hostPath:
            path: /etc/hostname
grafana側
grafana側のディレクトリ構成は以下のようになっています。
.
├── charts
│   └── grafana-dashboards
│       ├── Chart.yaml
│       ├── dashboards
│       │   └── python-metrics.json
│       └── templates
│           └── dashboard.yaml
├── grafana-value.yaml
└── helmfile.yaml
Dashbord周りは自作のチャートを使用します。
Chart.yamlは以下のようになっています。
apiVersion: v2
name: grafana-dashboards
version: 0.1.0
dashboard.yamlは以下のようになっています。
apiVersion: v1
kind: ConfigMap
metadata:
  name: grafana-dashboard-python-metrics
  labels:
    grafana_dashboard: "1"
data:
  python-metrics.json: |
{{ .Files.Get "dashboards/python-metrics.json" | nindent 4 }}
python-metrics.jsonにはダッシュボードの内容をjsonファイルとして保存しておきます。(jsonファイルは長いので割愛)
grafana-value.yamlは以下のようになっています。
service:
  port: 3001

datasources:
  datasources.yaml:
    apiVersion: 1
    datasources:
      - name: VictoriaMetrics
        type: prometheus
        access: proxy
        url: http://victoria-metrics-victoria-metrics-cluster-vmselect.monitoring:8481/select/0/prometheus
        isDefault: true

dashboardProviders:
  dashboardproviders.yaml:
    apiVersion: 1
    providers:
      - name: default
        orgId: 1
        folder: ""
        type: file
        disableDeletion: false
        editable: true
        options:
          path: /var/lib/grafana/dashboards/default

sidecar:
  dashboards:
    enabled: true
    label: grafana_dashboard
    folder: /var/lib/grafana/dashboards/default
helmfile.yamlは以下のようになっています。
repositories:
  - name: grafana
    url: https://grafana.github.io/helm-charts

releases:
  - name: grafana
    namespace: monitoring
    chart: grafana/grafana
    version: 10.4.0
    values:
      - ./grafana-value.yaml

  - name: grafana-dashboards
    namespace: monitoring
    chart: ./charts/grafana-dashboards
そして、払い出すと、以下のように各NodeのCPUの温度がダッシュボードで表示できました。
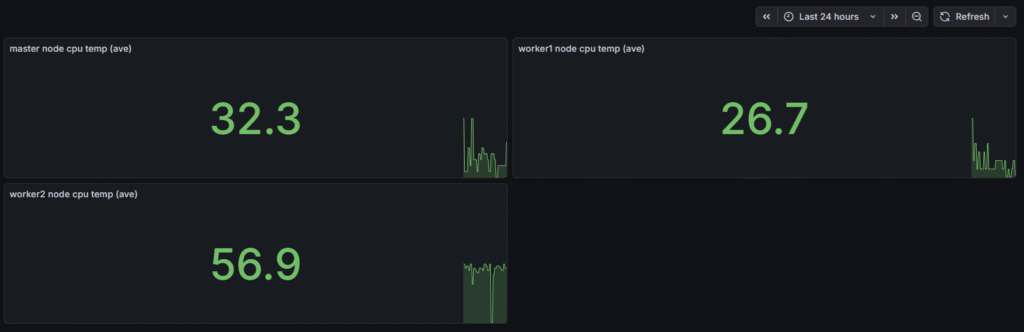
最後に
master nodeの負荷が高く、処理が重くなるので、今後master nodeで取得する値は外そうかなと思っています。