
はじめに
Githubにあるソフトウェアを皆さんは使っていますか?
僕は使っています。
使っていて、気になったのがリリースの頻度です。
コミット数は取得できるのですが、実際にリリースした数というのがどれくらいの頻度で行われているのかは確認できません。
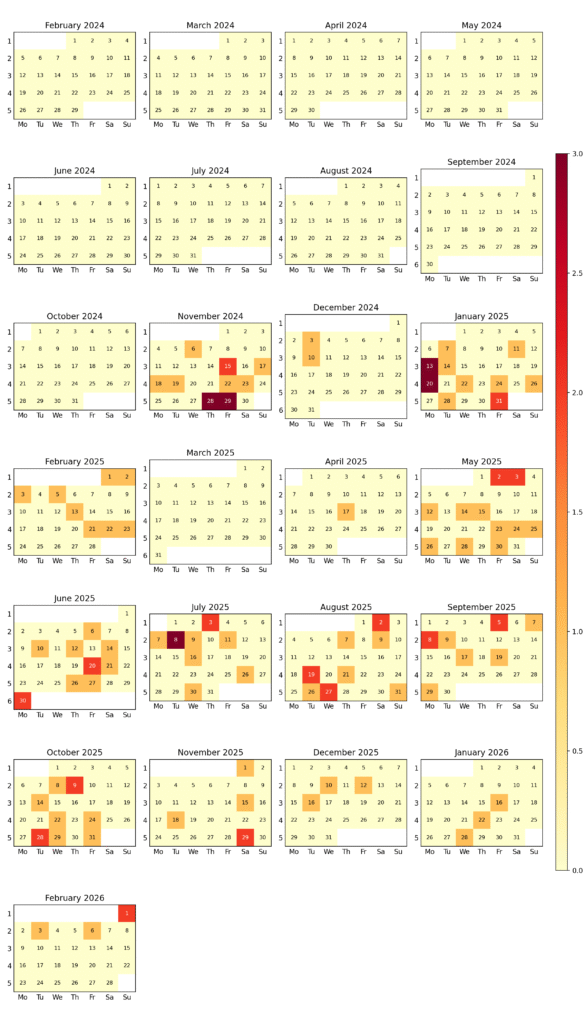
そこで、今回は頻繁にリリースされているのかというのを、確認できるようにするためにリリース頻度のカレンダーのヒートマップを作成しようと思います。
実装
実装はpythonで行い、以下のようなコードになりました。
import calendar
import collections
import datetime as dt
import sys
import time
from typing import Dict, List, Tuple

import matplotlib.pyplot as plt
import numpy as np
import requests
from bs4 import BeautifulSoup

REPO = "browser-use/browser-use"
TAGS_URL = f"https://github.com/{REPO}/tags"
REQUEST_INTERVAL_SECONDS = 5.0
_last_request_time = 0.0
CUTOFF_DAYS = 365 * 2
OUTPUT_IMAGE = "tag_release_heatmap.png"


def http_get(url: str, params=None):
    global _last_request_time
    now = time.monotonic()
    elapsed = now - _last_request_time
    if elapsed < REQUEST_INTERVAL_SECONDS:
        time.sleep(REQUEST_INTERVAL_SECONDS - elapsed)
    resp = requests.get(url, params=params, headers={"User-Agent": "tag-release-heatmap"})
    _last_request_time = time.monotonic()
    if resp.status_code != 200:
        raise RuntimeError(f"HTTP error {resp.status_code}: {resp.text}")
    return resp.text


def parse_tag_items(html: str) -> List[dict]:
    soup = BeautifulSoup(html, "html.parser")
    items = []

    for row in soup.select(".Box-row"):
        tag_link = row.select_one("a.Link--primary")
        clock_icon = row.select_one("svg.octicon-clock")
        time_tag = None
        if clock_icon:
            parent_li = clock_icon.find_parent("li")
            if parent_li:
                time_tag = parent_li.find("relative-time", attrs={"datetime": True})
        if time_tag is None:
            time_tag = row.select_one("relative-time[datetime]")
        if not tag_link or not time_tag:
            continue

        name = tag_link.get_text(strip=True)
        date_str = time_tag.get("datetime", "")
        if not name or not date_str:
            continue

        items.append({"name": name, "date": date_str})

    return items


def next_page_url(last_tag_name: str) -> str:
    if not last_tag_name:
        return ""
    return f"{TAGS_URL}?after={last_tag_name}"


def get_all_tags(cutoff_date: dt.date) -> List[dict]:
    tags = []
    url = TAGS_URL
    while url:
        html = http_get(url)
        page_items = parse_tag_items(html)
        if not page_items:
            break

        tags.extend(page_items)

        oldest_date = None
        for item in page_items:
            try:
                item_date = resolve_tag_date(item)
            except ValueError:
                continue
            if oldest_date is None or item_date < oldest_date:
                oldest_date = item_date

        if oldest_date and oldest_date < cutoff_date:
            break

        url = next_page_url(page_items[-1]["name"])

    return tags


def resolve_tag_date(tag: dict) -> dt.date:
    date_str = tag["date"].strip()
    normalized = date_str
    if normalized.endswith(" UTC"):
        normalized = normalized.replace(" UTC", "+00:00")
    if "T" not in normalized and "+" not in normalized and "-" in normalized[10:]:
        # Handles "YYYY-MM-DD HH:MM:SS" with timezone separated by space, e.g. "+0900".
        normalized = normalized.replace(" ", "T", 1)
    if "T" in normalized and normalized.endswith("Z"):
        normalized = normalized.replace("Z", "+00:00")

    try:
        return dt.datetime.fromisoformat(normalized).date()
    except ValueError:
        for fmt in ("%Y-%m-%d %H:%M:%S %z", "%Y-%m-%d %H:%M:%S %Z"):
            try:
                return dt.datetime.strptime(date_str, fmt).date()
            except ValueError:
                continue
        raise


def group_by_month(tag_dates: Dict[dt.date, List[str]]):
    grouped = collections.defaultdict(list)
    for d in sorted(tag_dates.keys()):
        grouped[(d.year, d.month)].append(d)
    return grouped


def month_range(start: dt.date, end: dt.date) -> List[Tuple[int, int]]:
    months = []
    cursor = dt.date(start.year, start.month, 1)
    end_month = dt.date(end.year, end.month, 1)
    while cursor <= end_month:
        months.append((cursor.year, cursor.month))
        if cursor.month == 12:
            cursor = dt.date(cursor.year + 1, 1, 1)
        else:
            cursor = dt.date(cursor.year, cursor.month + 1, 1)
    return months


def render_heatmap(tag_dates: Dict[dt.date, List[str]], output_path: str, start: dt.date, end: dt.date):
    months = month_range(start, end)
    if not months:
        raise RuntimeError("No months to render.")

    counts = {d: len(tags) for d, tags in tag_dates.items()}
    cal = calendar.Calendar(firstweekday=0)

    ncols = 4
    nrows = (len(months) + ncols - 1) // ncols
    fig, axes = plt.subplots(nrows=nrows, ncols=ncols, figsize=(12, 3 * nrows))
    axes = np.array(axes).reshape(-1)

    cmap = plt.cm.YlOrRd
    cmap.set_bad(color="white")

    max_count = max(counts.values(), default=1)

    for idx, (year, month) in enumerate(months):
        ax = axes[idx]
        weeks = cal.monthdayscalendar(year, month)
        grid = np.full((len(weeks), 7), np.nan, dtype=float)

        for i, week in enumerate(weeks):
            for j, day in enumerate(week):
                if day == 0:
                    continue
                d = dt.date(year, month, day)
                grid[i, j] = counts.get(d, 0)

        im = ax.imshow(grid, cmap=cmap, vmin=0, vmax=max_count)
        ax.set_title(f"{calendar.month_name[month]} {year}")
        ax.set_xticks(range(7))
        ax.set_xticklabels(["Mo", "Tu", "We", "Th", "Fr", "Sa", "Su"])
        ax.set_yticks(range(len(weeks)))
        ax.set_yticklabels([str(i + 1) for i in range(len(weeks))])
        ax.tick_params(axis="both", which="both", length=0)

        for i, week in enumerate(weeks):
            for j, day in enumerate(week):
                if day == 0:
                    continue
                color = "black" if grid[i, j] <= max_count * 0.6 else "white"
                ax.text(j, i, str(day), ha="center", va="center", fontsize=8, color=color)

    for ax in axes[len(months):]:
        ax.axis("off")

    fig.tight_layout(rect=(0, 0, 0.94, 1))
    cbar_ax = fig.add_axes([0.95, 0.15, 0.02, 0.7])
    fig.colorbar(im, cax=cbar_ax, label="Release count")
    fig.savefig(output_path, dpi=200)


def main():
    cutoff_date = dt.date.today() - dt.timedelta(days=CUTOFF_DAYS)
    end_date = dt.date.today()
    try:
        tags = get_all_tags(cutoff_date)
    except Exception as e:
        print(f"Failed to fetch tags: {e}", file=sys.stderr)
        sys.exit(1)

    tag_dates: Dict[dt.date, List[str]] = collections.defaultdict(list)
    for tag in tags:
        try:
            date = resolve_tag_date(tag)
            if date < cutoff_date:
                continue
            tag_dates2026/10/15.append(tag["name"])
        except Exception as e:
            print(f"Failed to resolve {tag.get('name')}: {e}", file=sys.stderr)

    render_heatmap(tag_dates, OUTPUT_IMAGE, cutoff_date, end_date)
    for date in sorted(tag_dates.keys()):
        versions = ", ".join(sorted(tag_dates2026/10/15))
        print(f"{date.isoformat()}: {versions}")
    print(f"Saved heatmap image to {OUTPUT_IMAGE}")


if __name__ == "__main__":
    main()
実行
出力された結果のカレンダー画像は以下のようになりました。
最後に
思っていたより、リリース頻度は無かったです(笑)